|
QUADRUPLE+ |
 |
GRRR
Emcore
(Nasdaq)
Published Our Report At $3.21
Hit $14.37
A Quadruple+ |
|
DOUBLE+ |
 |
RBT
Emcore
(Nasdaq)
Published Our Report At $1.16
Hit $3.06
A Triple+ |
|
TRIPLE+ |
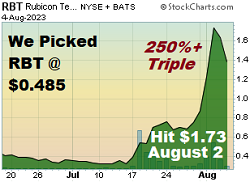 |
RBT
Rubicon Technologies
(Nasdaq)
Published Our Report At $0.485
Hit $1.73
A Triple+ |
|
Double |
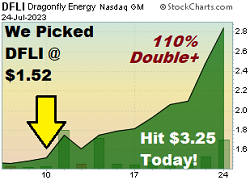 |
DFLI
Dragonfly Energy
(Nasdaq)
Published Our Report At $1.52
Hit $3.25
A Double In
Less Than TWO Weeks |
|
Triple |
 |
GFAI
Guardforce AI
(Nasdaq)
Published Our Report At $0.1744
Hit $0.59
A Triple In
Less Than TWO Weeks |
|
Double |
 |
BXRX
Baudax Bio, Inc
(Nasdaq)
Published Our Report At $3.28
Hit $6.98
A Double In TWO Weeks |
|
Double |
 |
HOWL
Werewolf Therapeutics
(Nasdaq)
Published Our Report At $1.80
Hit $4.56
A Double In A Few Weeks |
|
Another Double |
 |
WISA
Wisa Technologies
(Nasdaq)
Published Our Report At $0.0948
Hit $0.19
A Double In A Few Weeks |
|
Another - Double! |
 |
MMAT
Meta Materials
(Nasdaq)
Published Our Report At $0.91
Hit $2.25
A Double+ In
Less Than 4 Weeks |
|
Another - TRIPLE! |
 |
DRCT
Direct Digital Holdings
(Nasdaq)
Published Our Report At $1.28
Hit $3.85
200% Gain In 4 Weeks |
|
A Double In 2 Days |
 |
CNXA
Connexa Sports Technologies
(Nasdaq)
Published Our Report At $0.90
Hit $1.93 TODAY
110% Gain In Two Days |
|
150%! |
|
|
DRCT
Direct Digital Holdings
(Nasdaq)
Published Our Report At $1.28
Hit $3.20
150% Gain In Two Weeks |
|
Another Double+ |
 |
BLBX
Blackboxstocks Inc
(Nasdaq)
Published Our Report At $2.58
Hit $5.50
110%+ Gain |
|
A Double In 8 Trading Days! |
 |
DBGI
Digital Brands Group
(Nasdaq)
Published Our Report At $3.14
Hit $6.36
100% Gain In 8 Trading Days |
|
Double++! |
 |
IINN
Inspira Technologies
(Nasdaq)
Published Our Report @ $3.41
Hit $9.79
180% Gain |
|
Decuple - 970%! |
 |
AEHR
Aehr Test Systems
(Nasdaq)
Published Our Report @ $2.51
Hit $27.09
970% Gain |
|
DECUPLE - 900%! |
 |
CEI
Camber Energy
(NYSE American)
Published Our Report @ $0.4825
Hit $4.85
900% Gain |
|
Double! |
 |
GROM
Grom Social Enterprises
(Nasdaq)
Published Our Report @ $2.98
Hit $6.14
100% Gain |
|
Double+! |
 |
BBIG
Vinco Ventures
(Nasdaq)
Published Our Report @ $4.41
Hit $12.21
175%+ Gain |
|
Quadruple! |
 |
ANY
Sphere 3D
(Nasdaq)
Published Our Report @ $2.69
Hit $11.98
345% Gain In
About Eight Weeks |